HOW TO PREDICT THE END OF ELLIOTT'S IMPULSIVE FIFTH WAVES WITH PARALLEL TREND LINES
In a trading day, the EUR/USD currency pair just finished the fourth wave of Elliott's impulsive five waves in a bullish trend, and was just to complete the fifth wave. That time, I could predict the Elliot's impulsive five waves with 1.618 and 0.618 fibonacci ratios. I found the price levels with the 1.618 and 0.618 ratios within which the top of the fifth wave was expected to be appeared.
But the currency pair broke the price levels and went up. I started to find another effective way to predict the fifth wave of impulsive five waves, and I found the technique to predict the fifth wave with two parallel trend lines or a channel.
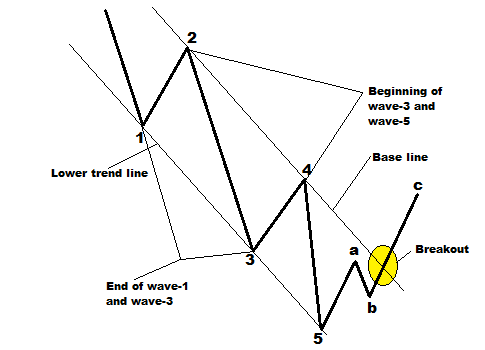
In the above illustration, I explained the way to predict the fifth wave in a bullish trend with two parallel trend lines. The trend lines are drawn after the end of the wave-1 and wave-3, and the beginning of wave-3 and wave-5 are confirmed.
Now the trend lines are drawn through the end of the wave-1 and wave-3, and the beginning of the wave-3 and wave-5. So, we have two trend lines. In a bullish market, the lower trend line is called the base line. In a bullish market, the fifth wave is expected not to break the upper trend line. Let me present the situation on a candle sticks chart.
In the above situation, impulsive five waves are leveled in two different ways. In first way(numbered with black numbers), the fifth wave is formed after the wave-4 ending on the base line. In second way(numbered with red numbers and letters), the three corrective waves follows the impulsive five waves, and the base line is broken by the corrective C wave.
In a bearish trend, the base line is drawn through the beginning of the wave-3 and wave-5, and the lower trend line is drawn through the end of wave-1 and wave-3. In a bearish trend, the situation is illustrated on a candlesticks chart below.
In the bearish market situation explained below, the impulsive five waves are more clearly leveled than the bullish market situation illustrated above. We can see the wave-5 did not break the lower trend line, and the base line is broken by the corrective wave-a.
Above explained situations are the generalized technique of predicting the Elliott's fifth wave with two parallel trend lines. On the real time price chart every situations are unique and may not be similar to the situations explained above. From the above discussion, we can drop the following core principles to predict the Eliott's fifth wave with two parallel trend lines.
1) The wave-5 should not break the upper trend line in bullish market and lower trend line in bearish market.
2) The waves should obey the core principles of Elliott's Wave Theory.
3) The base line can be broken by the corrective wave-a or wave-c.
4) The beginning point of wave-5 should be on the lower trend line in a bullish market and upper trend line in a bearish market.
Generally, the base line breakouts are entry signals. But a long and short order can be placed when the wave-5 is confirmed. We already know that the corrective three waves follow the impulsive five waves, so after the impulsive waves, corrective waves have to be considered to place orders.
If the order is placed at the top of the wave-5, the profit potential will be higher.But if the order is placed after the base line breakouts profit potential will be lower depending on the total elevation of the impulsive five waves.
This technique should be applied along with the technique of predicting Elliott's fifth wave with 1.618 and 0.618 Fibonacci ratios. It will increase the effectiveness of the prediction.
Dear Traders,
If you want to join the discussion with other traders, you can drop a comment below. You can also subscribe yourFXguide to receive updates right into your inbox.


0 comments:
Post a Comment